Documentation Index
Fetch the complete documentation index at: https://docs.syncara.host/llms.txt
Use this file to discover all available pages before exploring further.
Overview
While we recommend opening a support ticket if you encounter network issues, gathering diagnostic data using the methods below will significantly speed up the resolution process. Supplying this information helps our team pinpoint bottlenecks, identify latency sources, and effectively adjust routing or fix throughput problems.Diagnosing Packet Loss (From Your Local Machine)
If you suspect packet loss is occurring between your personal computer and your server, please perform the following tests. Note that these instructions must be executed from your local home PC, not the server itself.Windows
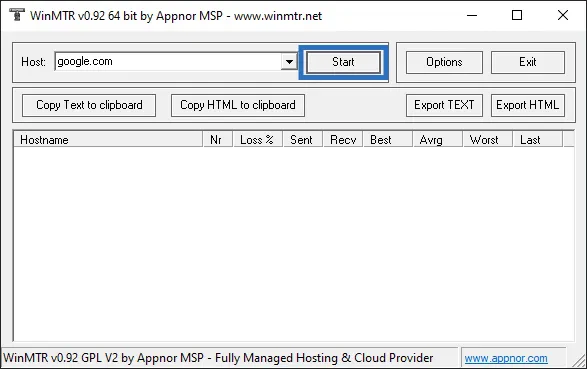
We recommend using WinMTR, a free, open-source diagnostic utility that measures latency and visualizes exactly where packet drops occur along the route. You can download it directly from SourceForge.- After downloading, extract the ZIP archive and run the
WinMTR.exeapplication. - Enter your server’s IP address into the
Host:field located at the top of the interface. - Click the
Startbutton and allow the tool to gather data for a few minutes. - Once you have collected enough data, click
Copy Text to clipboardand paste the results into your support ticket. This traceroute data is crucial for us to identify the exact hop causing the network disruption.
Linux or MacOS
For Unix-based operating systems, you can utilize the command-linemtr utility.
- Installation: Use your system’s package manager to install the tool. On Linux distributions, the package is typically named
mtrormtr-tiny. On macOS, you can install themtrpackage via Homebrew. - Execution: Open your terminal and run
mtr <serverip>, substituting<serverip>with your actual server IP address. Let the command run for several minutes, then copy the terminal output to your clipboard and attach it to your support ticket.